
SHARE


Some key digital Trends in the online travel industry, including digital travel trends, how customers research travel purchases, and more.
We’ve gathered and analysed data from 455,262,785 online user journeys and booking statistics from a range of Travel ecommerce websites, to provide you with comprehensive information including current trends, in depth statistics and crucial factors in the brand new 2023 Travel Ecommerce Stats & Trends Report.
Find out in-depth answers to all of your Travel ecommerce questions in the current climate – how are your customers browsing? When are customers most likely to commit to a sale? What is the best and proven way to grab their attention?
Online Travel Trends 2023 Key Stats
With total online sales peaking at 62.5% on desktop and 37.5% on mobile. Compared to 2021 we found that mobile has gained a little market share increasing 3%.
We can gather that, on average, around half of the overall visitors are committing to a sale. However when we delve deeper into the stats, we can start to analyse the complete customer journey – from browse to basket.
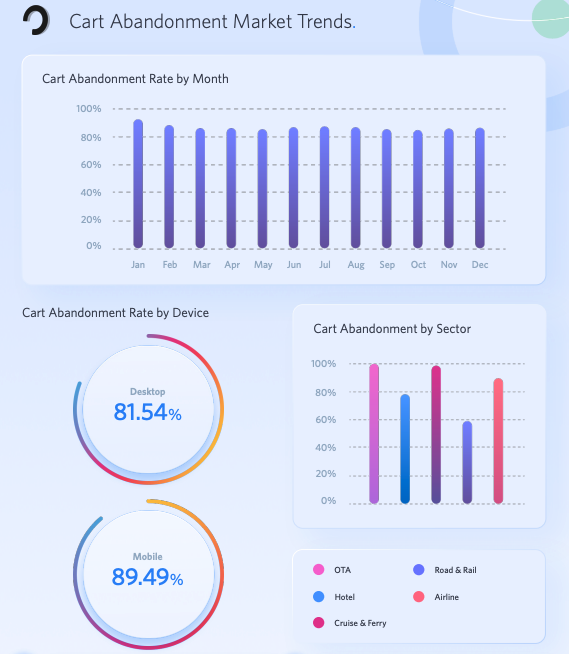
SaleCycle’s new 2023 online travel market research found users are abandoning their carts/bookings much less. In fact, desktop abandonment has improved 4%. Mobile abandonment has also improved by 2%.
Users show much higher intent to complete their purchase on desktop with an 8% lower abandonment rate than mobile users.
We can assume that the reason for this is that potential customers are browsing elsewhere across other travel websites, therefore leaving your sale behind.
Although the numbers here could seem alarming, this kind of consumer behaviour tends to occur when faced with committing to large purchases – we all want to find the best deal.
Also, these numbers indicate a much healthier place for the travel industry compared to the previous year. Online travel trends show that the sector is bouncing back in a big way.
So how do you decrease browse abandonment rates? SaleCycle specialises in decreasing your shopping cart abandonment rates with hundreds of insights and solutions to find the best outcome for your business. We cover topics to tackle abandonment rates across the board, with Beginner’s Guides to Cart Abandonment, all the way to the end goal of creating the most effective Cart Abandonment Emails, which we also delve deeper into in this article.
Travel Booking Platforms – Mobile vs Desktop Stats
This mobile vs. desktop conversion rates investigation overall shows us that mobile rates, including browse abandonment and online traffic, are significantly higher than desktop figures.
The reason for this could be down to the fact that mobile is a much more dynamic way to shop across the majority of ecommerce platforms, with the ability to be able to open and close windows with ease, for example.
However when it comes to committing to a large travel ecommerce sale, we can see that these shoppers lean towards using desktop. This being the only desktop result (at 62.5%) with a higher percentage of consumers.
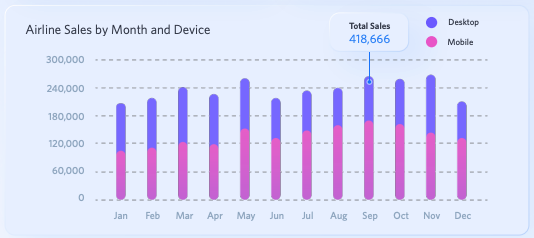
From this Report, we have also gathered that 58% of all Airline sales are purchased on desktop. But why are mobile conversion rates behind desktop here?
We have seen in previous and current customer behaviour reports that this is a common theme. Consumers feel more at ease buying larger products – such as a flight or holiday – on a larger screen, compared to other ecommerce sectors such as retail and fashion, which totals at a higher percentage of 56.06% on mobile sales.
For one, it can be easier to navigate around a site and view important information on a bigger screen, so some shoppers may browse and research online travel on mobile and select a choice later on. People are also more likely to buy on a desktop when purchases are more complex – in this case, Travel purchases fit under this concept.
Online Travel Sales Trends by Sector
When looking at total sales by month in the Travel sector, it mostly comes down to customer behaviour and how we act as consumers depending on different environmental and seasonal factors.
For example, we can see that Cruise and Ferry sales peaked in July – during the height of the summer, also known as the typical British ‘Summer holiday’ season. Airline sales also peak around summer months as well as winter months, which can also be associated with the holiday season.
In that same instance, Road and Rail stays fairly consistent throughout the financial year. This may be due to the fact that we rely on this sector for everyday commutes, and not just vacation-style journeys.
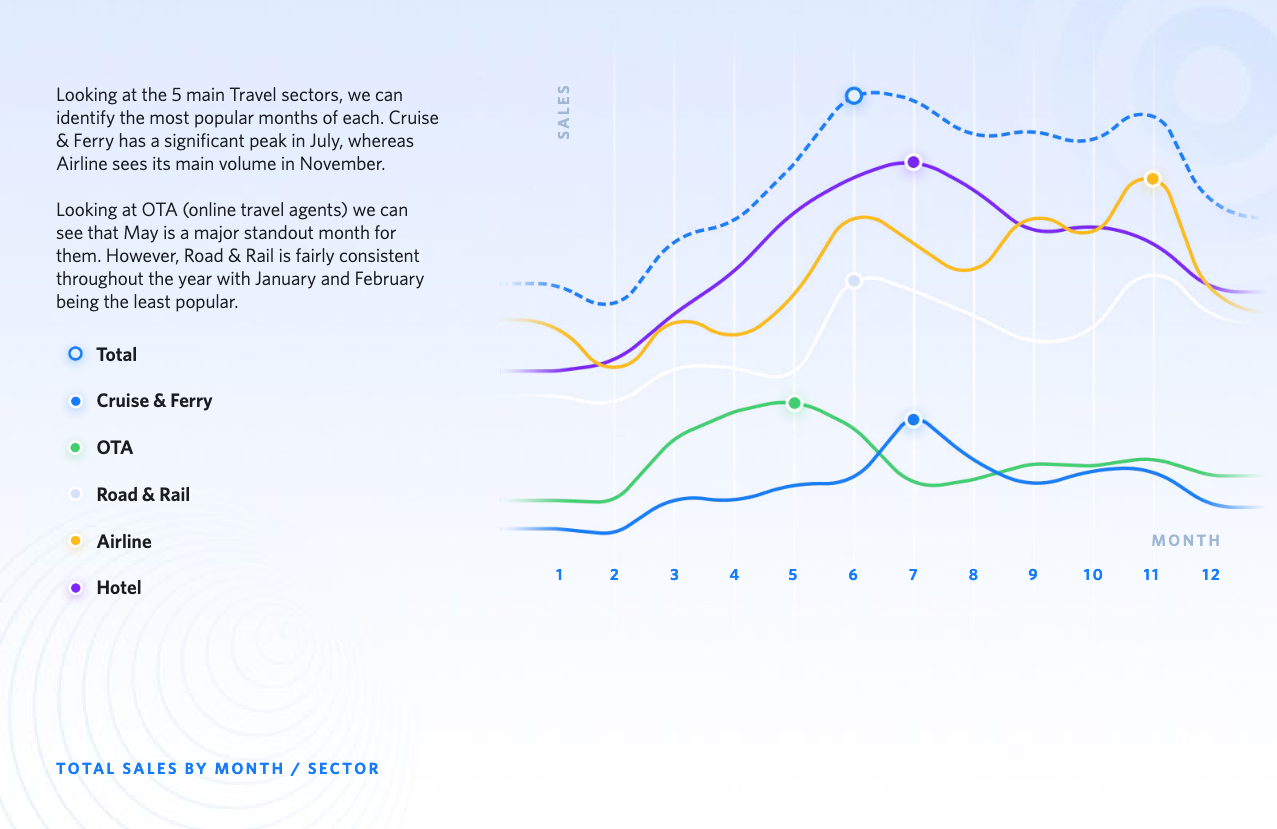
For all Travel sectors, the least popular time to make a purchase (and therefore travel) is at the beginning of the year – January and February. We can assume that this is down to potential consumers’ state of affordability at the start of a new year. Again, this is because seasonal factors come into play and so, there is a need to improve holiday season performance – this is a challenge, however when we can gather that November through to December (the Christmas period) is driven by December online sales and festive shopping, which is often followed by a rest in spending.
With this information, you can gather that this is a crucial time to introduce enticing opportunities for the customer. Personalised content in email campaigns could come into play here, alongside potentially your own sale period and online remarketing strategies.
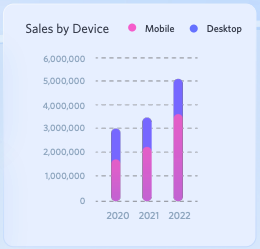
Total Online Travel Sales by Device & Year
SaleCycle tracks and compiles data from user journeys in the Travel sector on both mobile and desktop to understand and then present the most authentic results. Year after year, it is clear that total online sales via mobile has increased when compared to desktop sales – presented here in this infographic.
Although desktop sales are still leading the way in Travel, we can see that consumers are gradually becoming more confident in completing a purchase with their mobile device.
We saw this trend especially from the start of the pandemic to post-pandemic, where a total of 110% growth in online sales via mobile in travel occured. So how can you reduce mobile cart abandonment rates within the Travel Sector?
The Travel sector has been known for its desktop-heavy conversions, with excessive form fields and documents (such as booking terms and conditions), something that can seem daunting when compressed onto a small screen.
However, it seems that Travel companies have caught onto this issue and are slowly but surely optimising their ecommerce pages to fit a mobile screen using tailored mobile form design strategies, overall improving the customer journey.
Testing different formats of ecommerce websites is something we highly recommend across all sectors. Doing ecommerce AB Testing best practices and website optimisation as a whole can produce the kind of positive results we see here in the Travel sector.
Online Travel Traffic vs Browse Abandonments
All ecommerce brands want to understand their customers to the best possible degree in order to capture a sale. By comparing online traffic and browse abandonment rates, we are able to gauge intent levels of users throughout the year, which can be utilised to get you the best conversions going forwards.
In this Report, we can see that browse abandonment rates are at their highest in December at 83.43%, meaning that customers are currently more likely to decide against a purchase at this time of year compared to any other month. February is also when there is the least amount of online traffic, which we can see here in this graph.
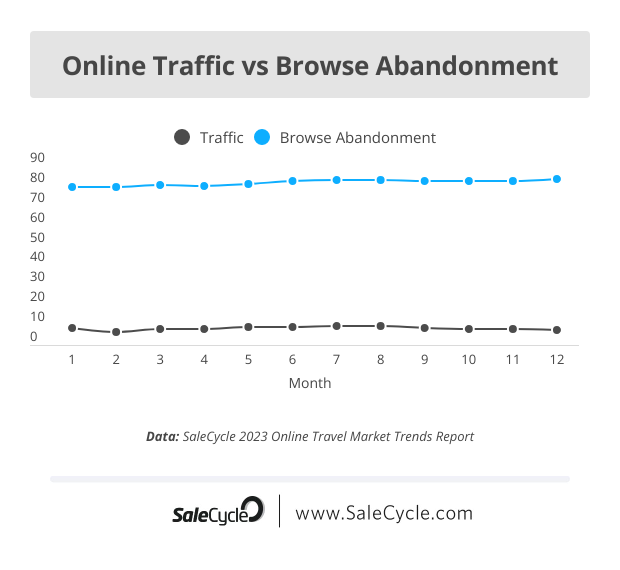
However, browsing still exists and therefore can still be utilised to create engagement. Call to action tools such as browse abandonment emails and browse reminders would be most useful during this time, to remind your customers to reconsider their commercial intent. It’s vital to keep these potential customers engaged over the long term.
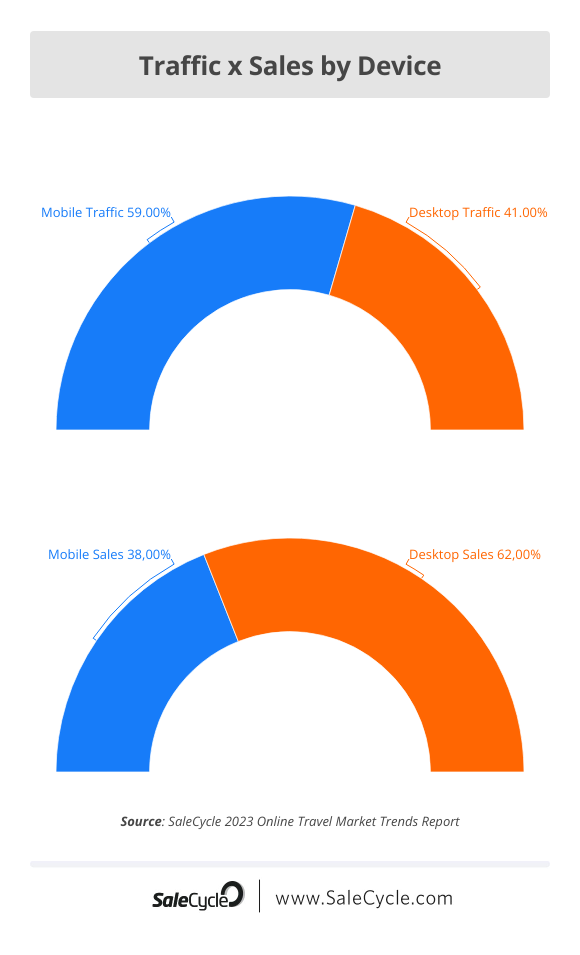
By Device
As mentioned in the Report previously, mobile is leading the way when it comes to online traffic and browsing travel sites, taking up a total of 59% of all online traffic, which is 4% higher that the previous year.
However, total online sales via mobile is just 37.5%, paired with a mobile browse abandonment rate of 84%. This suggests users use their mobile devices to browse more than purchase.
So, in order to maximise online sales opportunities, travel ecommerce sites need to consider this phase of the consumer’s journey and put tools in place to help make that final purchase decision. Email marketing including browse abandonment emails alongside email personalisation are just some of the many methods we at SaleCycle cover, to see a positive shift in overall conversion rates.
Online Travel Cart Abandonment Email Metrics
Our 2023 Travel Ecommerce Stats & Trends Report has shown that Travel sector email open rates, compared to the overall ecommerce market, are significantly much higher:
- Ecommerce Average: 34.97%
- Travel Sector Average: 57.91%
This could be down to travel businesses using personalisation in emails to their advantage – for example, features such as personalised destination data.
Call to action, or ecommerce CTA, also plays an important role in the travel sector with fluctuating prices, peaking the interest of customers and driving them to make a faster purchase decision.
As a whole, cart abandonment emails perform very well in the travel industry. We know that travel customers take a longer amount of time to complete a purchase compared to other ecommerce sectors, and therefore marketing correctly with cart abandonment emails can play a huge role in helping that decision along.
So overall – well-timed, multicycle cart abandonment emails are a great tool.
Online Travel and Universal Search
With the advent of universal search, whereby Google shows multimedia results, the days of ten blue links on search results pages are long gone.
For online travel searches, more space is now being taken up by universal search elements.
These include Knowledge Graphs, which appeared in 65% of desktop and 22% of mobile travel searches, maps (17% desktop, 23% mobile), and images (18% desktop, 15% mobile).

Tripadvisor and Online Travel Research
With more than 325m monthly users, Tripadvisor is in a position to influence a lot of online travel purchases.
Travel customers who visit Tripadvisor are also more likely to take time over research, with more than 80% taking more than four weeks to complete a purchase.

It’s also a popular starting point for many travel searches, especially in the earliest phases of travel research.

Abandonment Rates in Travel
The average abandonment rate for online travel sites was 85.63% in 2022, according to our recent data.
For comparison, the average overall ecommerce abandonment rate was 79.53%.
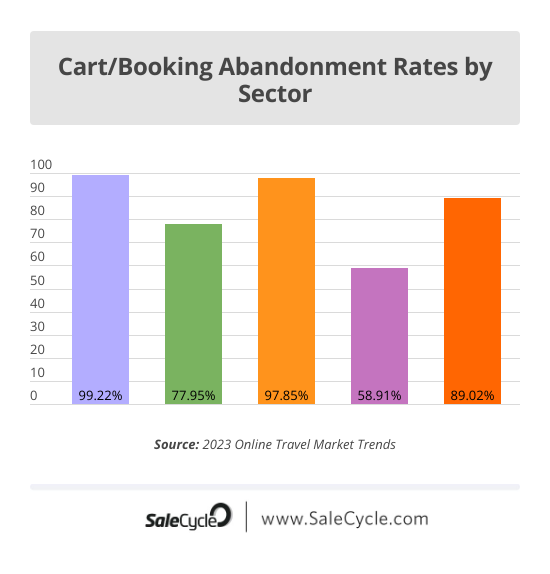
Online travel generally involves a longer research and booking process, and can be the high cost purchases, so this does mean abandonment rates can be relatively high.
Some travel purchases can be simpler than others, such as hiring cars and booking hotels, so we see lower abandonment rates for these types of travel sites.
Online Travel Abandonment Trends
Abandonment rates tend to be lowest at peak times for buying, such as promotional events, or during certain seasons.
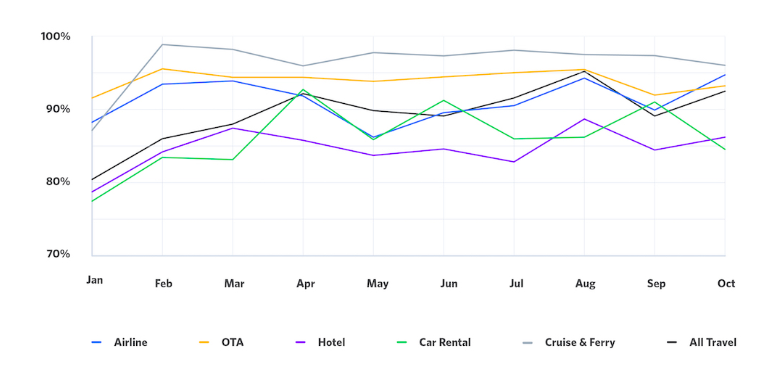
For this reason we can see a dip in abandonment rates for most travel sectors around January, perhaps as people begin to book holidays for the summer.
For airlines and travel especially, we see a further dip in abandonment rates around May, possibly due to travellers booking last minute holidays for the summer months.
Why Hotels Should Ask Customers to Leave Reviews
A report from TrustYou finds strong reasons why hotels should contact customers and ask for reviews.
- 80% of customers who received a request left a review. Just 22% wrote a review without being asked.
- The majority (54%) of guests have experience writing and submitting at least one review in the previous 12-months.
- On average, 95% of traveler reviews are positive; 93% of travelers’ most recent reviews are reportedly positive.
Why Travel Bookers Prefer Apps to Mobile Web
Travelport Digital looked into the travel activities people use apps for and why they would choose to use apps ahead of mobile websites.

Speed and increased functionality were the most popular reasons to favour apps, as well as the ability to receive useful updates.
People value updates on trip status, price alerts and discounts, as well as reminders of bookings in progress.

The key theme here is user experience. Apps can mean a better experience, and the travel brands with the best apps stand to benefit here.

Best Travel Sites on Mobile
According to a Google study of speed and usability, these are the UK’s top ten travel sites on mobile.

Hotel Conversion Rates
The average conversion rate for hotels is 2.2%, according to a study by Fastbooking.
However, conversion rates vary between hotel sites, with the top 20% of hotels averaging 5.6% compared with 0.3% for the bottom 20%.
Preferred Devices for Travel Bookings by Country
Desktop remains the most popular device for making travel bookings, according to a report from EyeforTravel.

Airlines and Social Customer Service
A study from Conversocial looks at the performance of US and Europe / Middle Eastern airlines on social media.

It found that US airlines respond faster on average, but are less responsive overall than their EMEA counterparts.
Travel Booking Search Trends
The Travel Market Performance Report from PI Datametrics looks at search trends in the travel industry.
The report looks at share of voice across the UK flights market, showing the sites that appear most often for flight related search terms.
The top 3 performers own 52.6% of the entire flights market, with Easyjet the best performing airline.

In the US, there’s a similar pattern, with the top three owning 57% of the entire flights category.


Reviewed by Brad Ward
Written by Brad Ward
— Updated on 22/08/2023
NEW EBOOK
⬛️ 2023 Black Friday Ecommerce Strategy & Stats Report
This FREE ebook gives you the methods, solutions & trends for building a high-converting remarketing strategy for Black Friday

Speak to an expert
Learn how to convert your online audience into revenue with our experts.

Graham Charlton
Graham Charlton is Editor in Chief at SaleCycle. He's been covering ecommerce and digital marketing for more than a decade, having previously written reports and articles for Econsultancy. ClickZ, Search Engine Watch and more.

![Valentine’s Day Ecommerce Tips and Trends [2024 Strategy]](https://www.salecycle.com/wp-content/uploads/2019/01/valentines-ecommerce-1.png)


![What Is A Good Conversion Rate? [Stats By Industry]](https://www.salecycle.com/wp-content/uploads/2017/10/Why-a-Structured-Approach-to-Conversion-Rate-Optimization-Is-Crucial.jpg)